Sunday, April 29, 2012

The current market correction is over

The daily price chart for SPY (S&P500 ETF) is showing a strong price pattern for upward movement of prices. This changed in the last two days because of the price action we had on this ETF, since April 25, 2012.
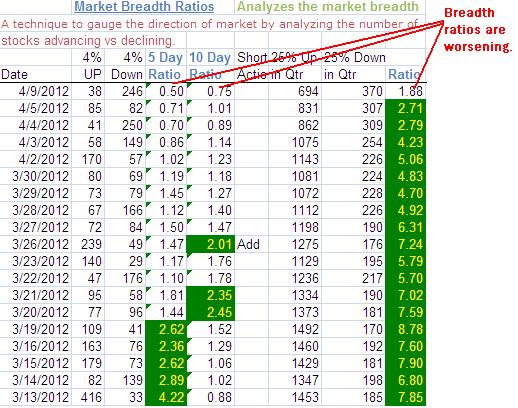
On the Market Breadth Ratios we went from a “Sell” signal to a “Buy” signal with 15 trading days. We got a “Buy” signal on this chart on 4/26/2012.  This correction happened in a long term uptrend on S&P500 and Russell 2000 (representing the big cap and small cap indexes).
With the current correction being over we should buy good growth stock, with prudent risk management. Investor’s Business Daily is a good source for getting ideas on good growth stocks. They have lists like IBD 50, Sector Leaders for generating ideas about stocks showing strong fundamental and technical characteristics.


Thursday, April 26, 2012

Beginning of the end of the current correction has started

The beginning of the end of the current correction has started. However the current market correction is not yet over.
The daily price chart for SPY (S&P500 ETF) is not showing convincingly that the correction is over.  We should wait a few days to make sure that the price pattern is not a “wedging” pattern.
The long term trend in both S&P500 and Russell2000 is still up. The medium term correction we are experiencing could be over soon. We just need to wait and watch the market. We can start to commit some money to the market (with very tight risk management), but wait to commit more fully till we get a clear sign that the correction is over.

Monday, April 23, 2012

Market correction is still underway.

Correction which started for S&P500 index on 4/2/2012 is not over yet. Market Breadth Ratios have deteriorated (see chart below).
The long term trend in both S&P500 and Russell2000 is still up. We are experiencing a medium term correction in a long term up market.
We need to wait out this correction before we commit any money to the market.


Thursday, April 19, 2012

Correction in the Market is not over yet

Short term correction which started for S&P500 index on 4/2/2012 is not over yet. We need to wait for the black line (shown in the chart below) to turn up before we can say the current correction is over. At the same time we should also look for a confirmation that the correction is over from the Market Breadth Ratios.
The most recent correction in small cap stocks (using Russell 200 ETF (IWM) as a proxy) started on 3/27/2012, is also not over yet.


However the long term trend in both S&P500 and Russell2000 is up. We are experiencing a short to medium term correction in a long term up market.

Monday, April 16, 2012

We are still in a correction mode

We need to wait for the black line to turn up before we can say the current correction is over. At the same time we should also look for a confirmation that the correction is over from the Market Breadth Ratios.
The long term trend currently, is still up.
Once the current correction is over and the long term trend is still up, the opportunity to buy good growth stocks at that time, with little downside risk, will be very good.


Tuesday, April 10, 2012

In times like this, what should we to do with our stock holdings?


On April 4, 2012 this site told us that the market may go into a short term correction, though the long term uptrend is still intact.
In times like this, what should we to do with our stock holdings?
Answer: This is the time to sell stocks where the price action is not performing well, in other words the price action is showing weakness.
Some of the sell rules are:
a.       The price has gone 8% below buy price.
b.      The stock price has broken down on high volume.
c.       The stock price is forming a “wedge”. A “wedge” pattern is when the stock price goes down, then tries to rally up but the rally is anemic.
d.      If the stock price has had a long advance and then closes below 10-week moving average and stays there for 8 to 9 consecutive weeks.

Money from selling these stocks should be invested in the remaining stocks in your portfolio when there is a follow through rally in the market (indicating that the short term correction is over).

The thing to remember is that a short term correction can turn into a long term correction. The technique employed here to weed out weak stocks and not put that cash back into remaining stocks, till we get a follow through rally, will have the effect of getting us more and more into cash as the short term correction proceeds. In case the short term correction turns into a long term correction or a bear market, we will already be holding some cash and thus not get a big downside hit to our portfolio.

Monday, April 9, 2012

Wednesday, April 4, 2012

The long term uptrend in the market is still intact

This Rally started in late December when the Fed made a decision to increase liquidity because of the European crisis. Now the Fed has indicated that it may not have another round of quantitative easing, this has caused the market to show signs of correction. The technical price action, even before the Feds announcement, was showing that the market was due for a correction.
The small cap stocks had gone into a basing mode since early Feb 2012. The big cap stock indexes were doing better because of names like Apple (AAPL) and Priceline (PCLN). The Feds action may act as a catalyst to send the big cap indexes in a correction phase.
The underlying price action on a number of growth stocks still looks good. This means that it is more likely that we may have a short term correction in the market, setting it up for another leg up after that. The long term uptrend in the market is still intact.


Market Breadth Ratios are indicating a Short Term Correction (STC).